You’ll need 2 windows:
- A text editor or IDE (Visual Studio Code, Pycharm, Spyder, neovim, Atom, Jupyterlab ...)
- Klayout to Visualize the GDS files. With the
kliveklayout package for showing GDS files when you run. Tools -> Manage PackagesComponent.show()
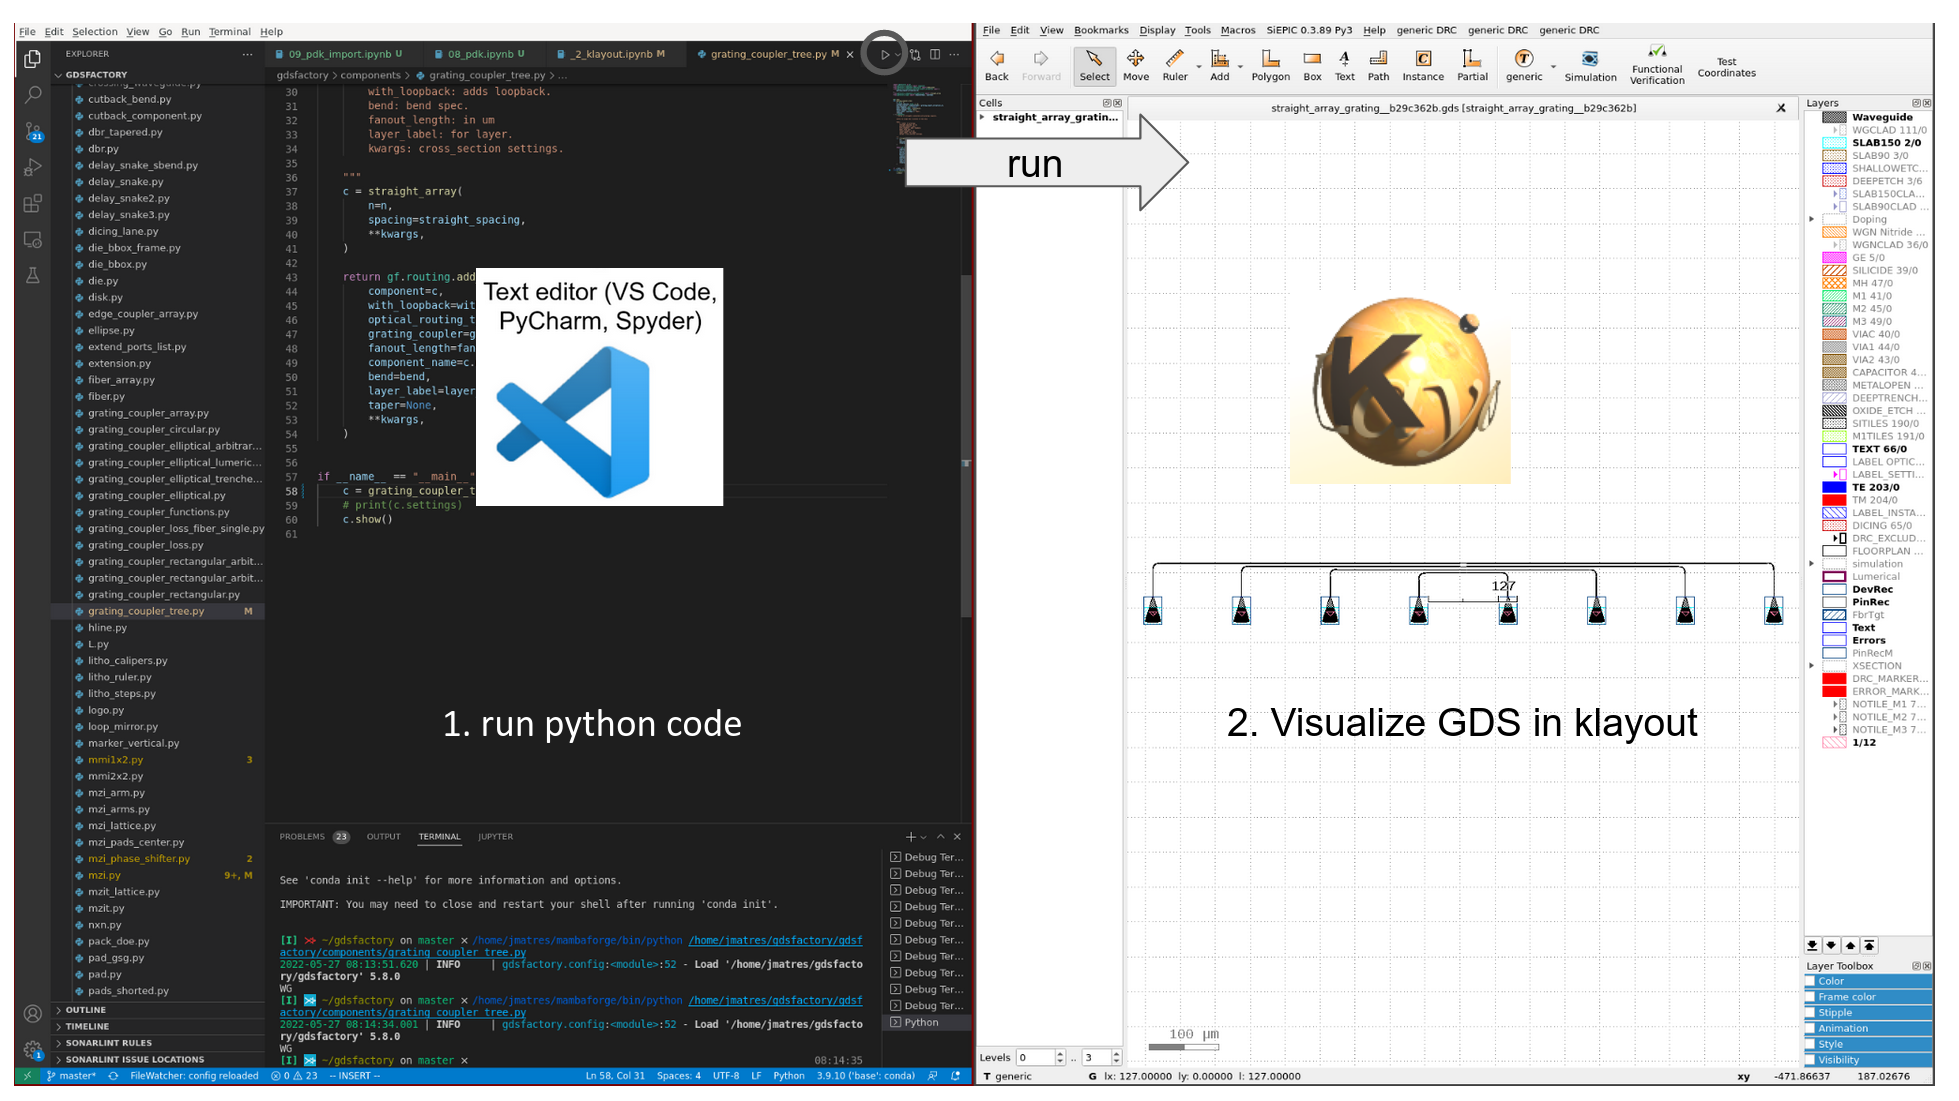
1. Standard Python flow
- You write your PCells in python.
- You execute the python code.
- You visualize the GDS Layout in Klayout.
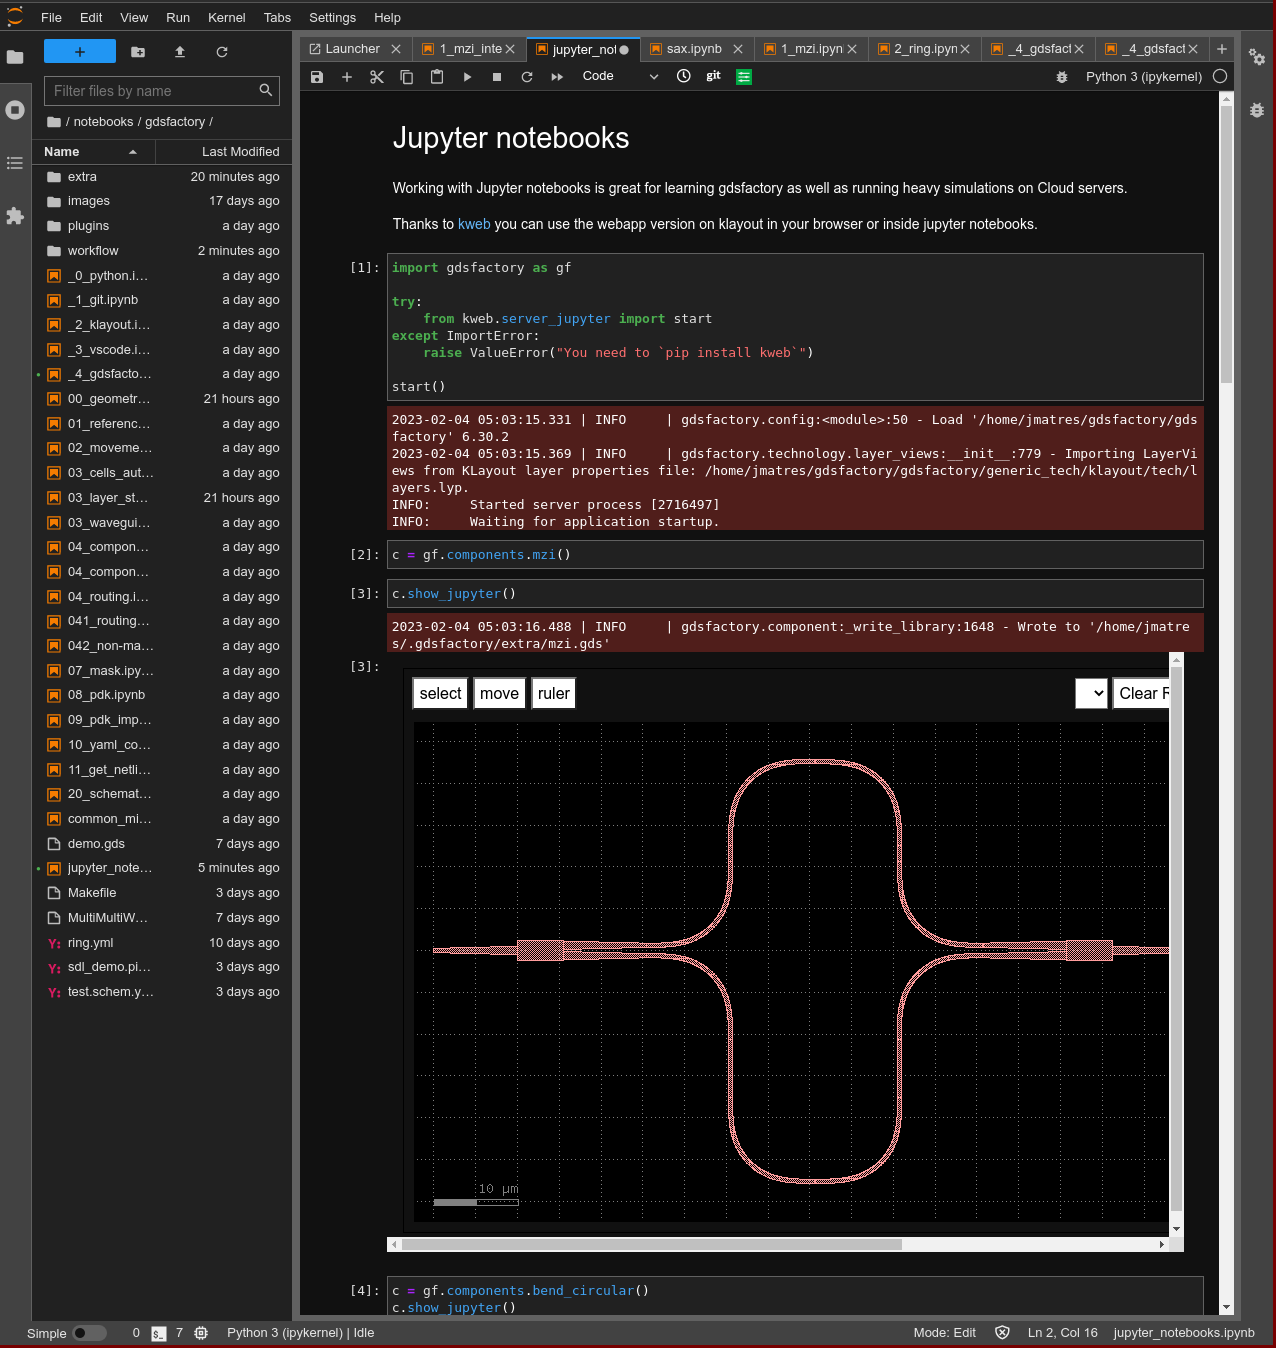
The standard python flow can leverage all machine learning tools such as Jupyter notebooks.
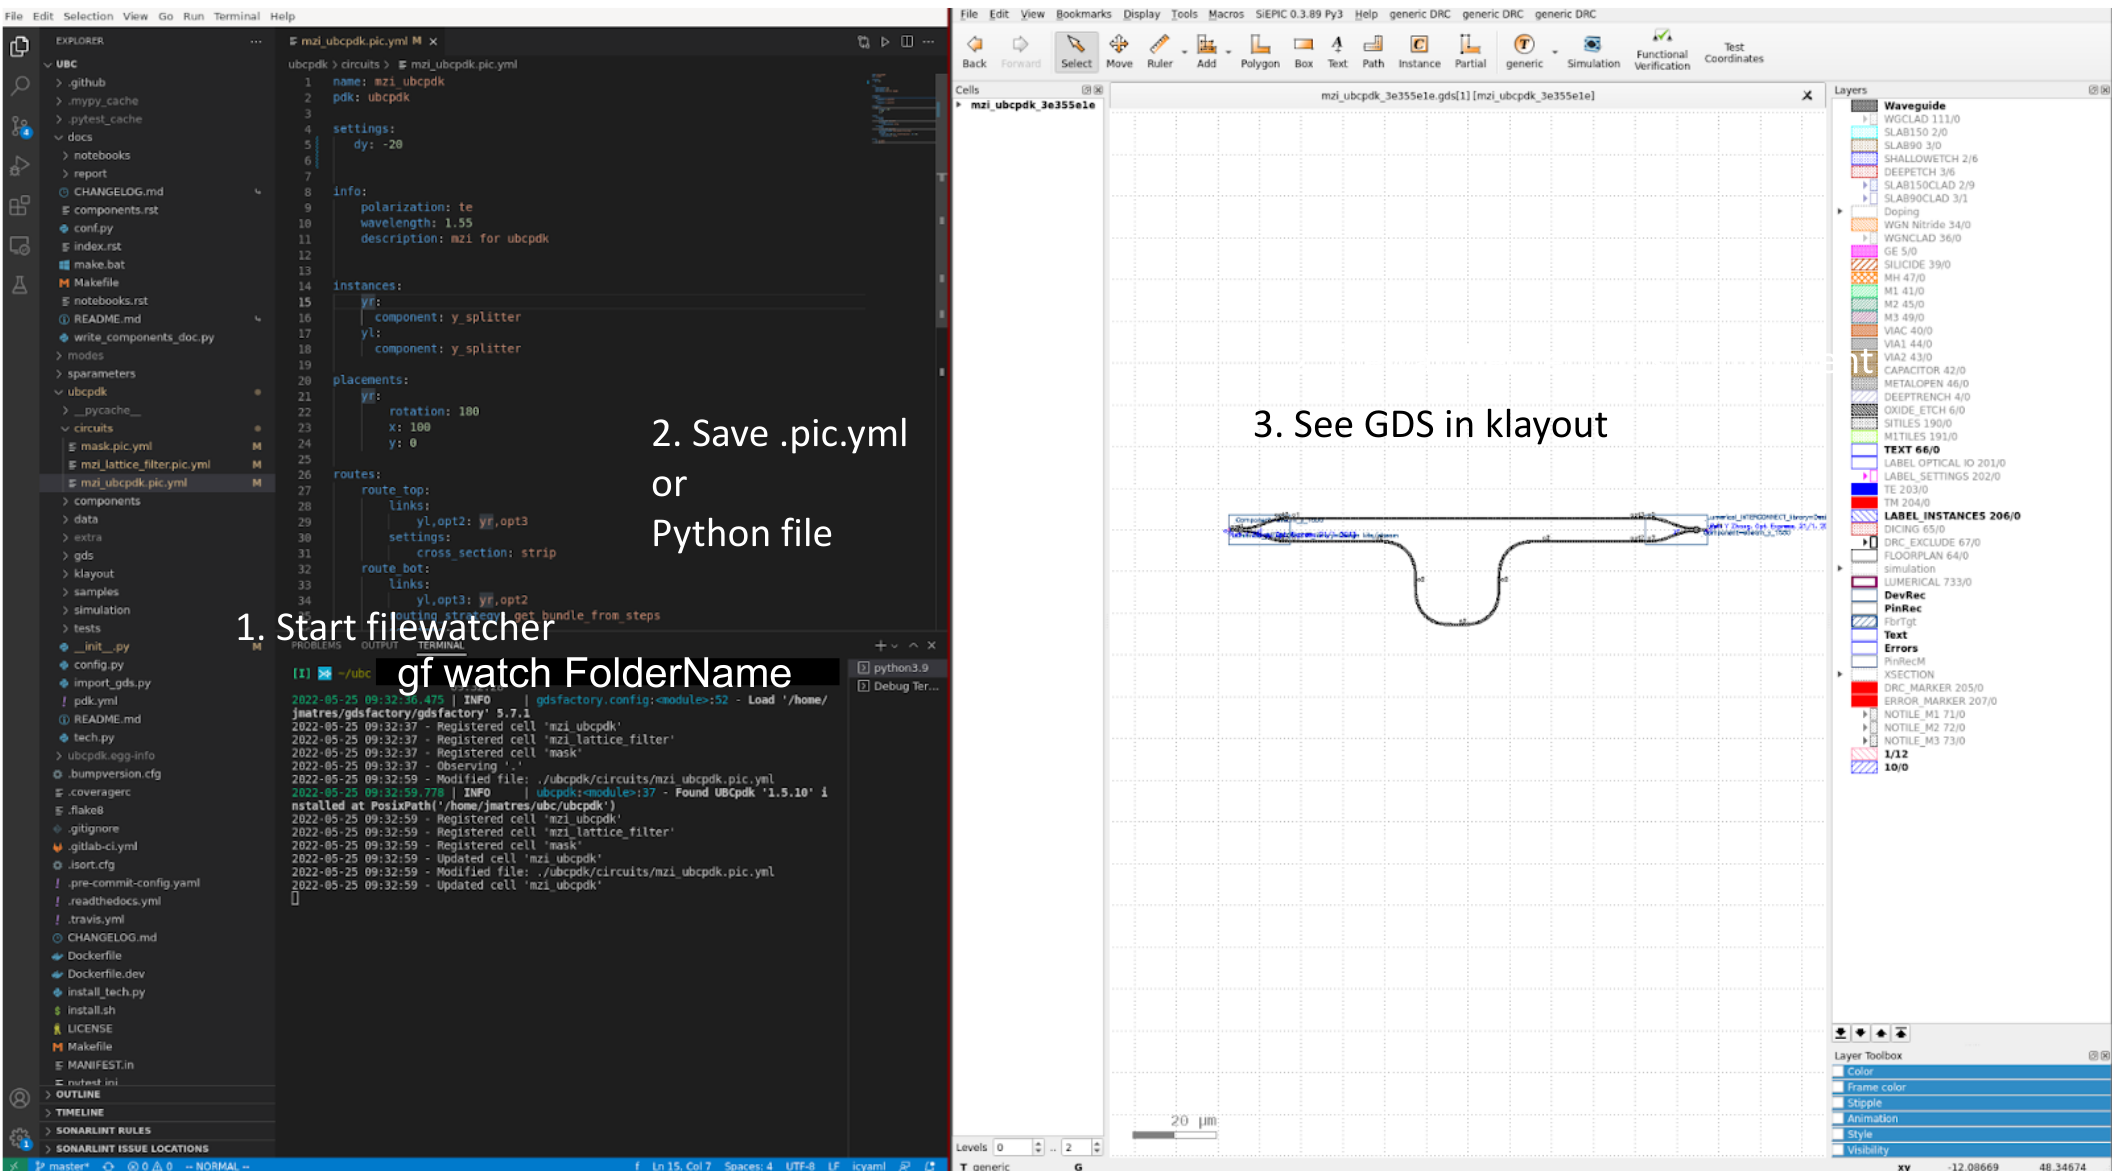
2. File-watcher flow
For building large components can use a file-watcher and see your updates in KLayout.
- You execute the file watcher
gf watch FolderNameor in the current working directorygf watch - The file-watcher re-runs any python file
.pyor YAML.pic.yaml. - Thanks to the
cellcache you can see your new component changes live updating the layout in Klayout.
3. Webapp flow
You can also use a webapp to:
- visualize your PDK components and change the Parametric Cell (PCell) settings.
- visualize the GDS layout of the last saved files in a particular directory.
- turn on a file watcher and watch changing files in specific folders.
To run the webapp you can just run gf webapp in the terminal. By default it will use the generic_pdk technology.
To use a different PDK you can use the --pdk flag. For example gf webapp --pdk ubcpdk.