gdsfactory provides you with some geometric functions
Boolean / outline / offset / invert
There are several common boolean-type operations available in the geometry library. These include typical boolean operations (and/or/not/xor), offsetting (expanding/shrinking polygons), outlining, and inverting.
Boolean
The gf.geometry.boolean() function can perform AND/OR/NOT/XOR operations, and will return a new geometry with the result of that operation.
import gdsfactory as gf

E = gf.components.ellipse(radii=(10, 5), layer=(1, 0))
R = gf.components.rectangle(size=[15, 5], layer=(2, 0))
C = gf.geometry.boolean(A=E, B=R, operation="not", precision=1e-6, layer=(3, 0))
# Other operations include 'and', 'or', 'xor', or equivalently 'A-B', 'B-A', 'A+B'

# Plot the originals and the result
D = gf.Component("bool")
D.add_ref(E)
D.add_ref(R).movey(-1.5)
D.add_ref(C).movex(30)
D.plot()
2023-12-09 17:29:55.849 | WARNING | gdsfactory.pdk:get_active_pdk:721 - No active PDK. Activating generic PDK.
2023-12-09 17:29:56.148 | INFO | gdsfactory.technology.layer_views:__init__:790 - Importing LayerViews from YAML file: '/home/runner/work/gdsfactory/gdsfactory/gdsfactory/generic_tech/layer_views.yaml'.
2023-12-09 17:29:56.149 | INFO | gdsfactory.pdk:activate:334 - 'generic' PDK is now active
To learn how booleans work you can try all the different operations not, and, or, xor
import gdsfactory as gf
operation = "not"
operation = "and"
operation = "or"
operation = "xor"
r1 = (8, 8)
r2 = (11, 4)
r1 = (80, 80)
r2 = (110, 40)
angle_resolution = 0.1
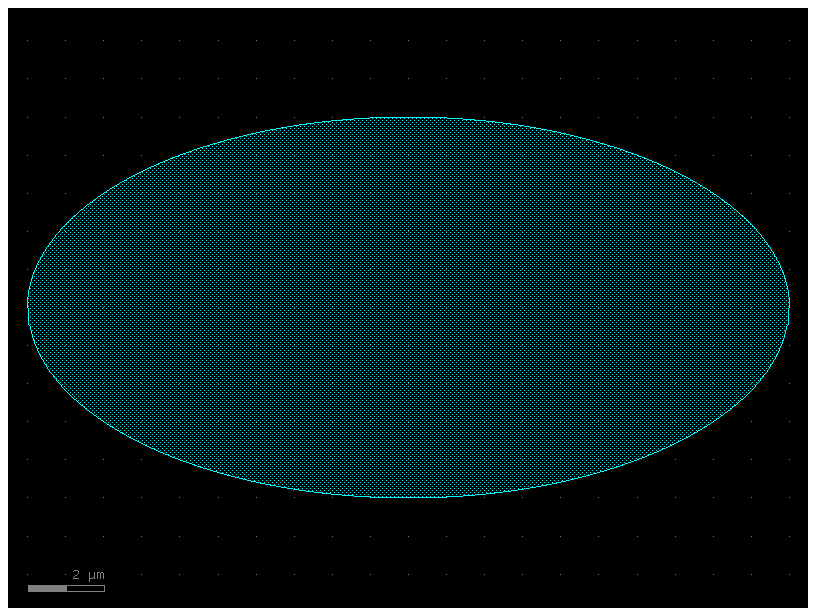
c1 = gf.components.ellipse(radii=r1, layer=(1, 0), angle_resolution=angle_resolution)
c2 = gf.components.ellipse(radii=r2, layer=(1, 0), angle_resolution=angle_resolution)%time
c3 = gf.geometry.boolean_klayout(
c1, c2, operation=operation, layer1=(1, 0), layer2=(1, 0), layer3=(1, 0)
) # KLayout booleans
c3.plot()2023-12-09 17:29:56.746 | INFO | gdsfactory.component:_write_library:1937 - Wrote to '/tmp/gdsfactory/ellipse_4aa83906.gds'
2023-12-09 17:29:56.747 | INFO | gdsfactory.component:_write_library:1937 - Wrote to '/tmp/gdsfactory/ellipse_cb56ffd1.gds'
CPU times: user 6 µs, sys: 3 µs, total: 9 µs
Wall time: 5.72 µs
%time
c4 = gf.geometry.boolean(c1, c2, operation=operation)
c4.plot()
CPU times: user 5 µs, sys: 3 µs, total: 8 µs
Wall time: 5.72 µs
Offset
The offset() function takes the polygons of the input geometry, combines them together, and expands/contracts them.
The function returns polygons on a single layer and does not respect layers.
import gdsfactory as gf

# Create `T`, an ellipse and rectangle which will be offset (expanded / contracted)
T = gf.Component("ellipse_and_rectangle")
e = T << gf.components.ellipse(radii=(10, 5), layer=(1, 0))
r = T << gf.components.rectangle(size=[15, 5], layer=(2, 0))
r.move([3, -2.5])

Texpanded = gf.geometry.offset(T, distance=2, precision=1e-6, layer=(2, 0))
Texpanded.name = "expanded"
Tshrink = gf.geometry.offset(T, distance=-1.5, precision=1e-6, layer=(2, 0))
Tshrink.name = "shrink"

# Plot the original geometry, the expanded, and the shrunk versions
offsets = gf.Component("top")
t1 = offsets.add_ref(T)
t2 = offsets.add_ref(Texpanded)
t3 = offsets.add_ref(Tshrink)
offsets.distribute([t1, t2, t3], direction="x", spacing=5)
offsets
2023-12-09 17:29:57.192 | WARNING | gdsfactory.klive:show:48 - Could not connect to klive server. Is klayout open and klive plugin installed?
top: uid df969ef7, ports [], references ['ellipse_and_rectangle_1', 'offset_1', 'offset_2'], 0 polygons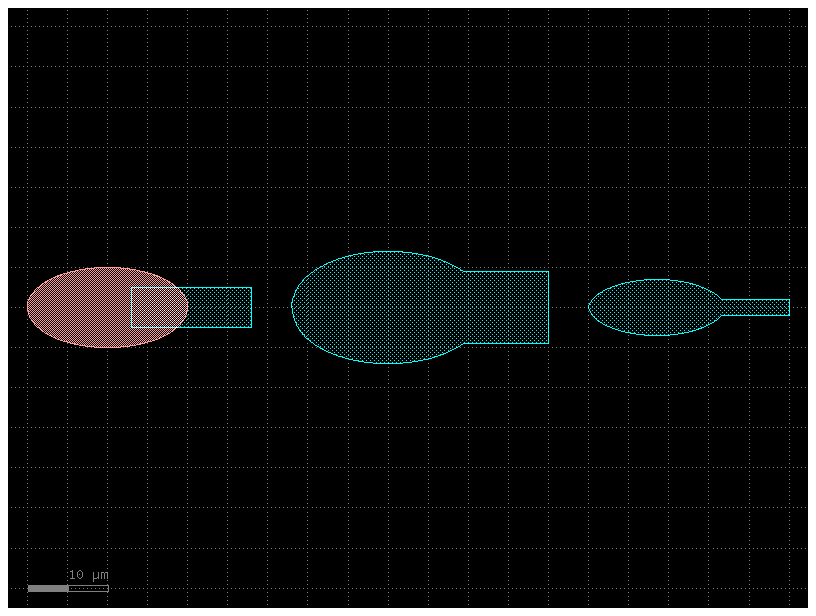
gf.geometry.offset is also useful for remove acute angle DRC errors.
You can do a positive offset to grow the polygons followed by a negative offset.
c = gf.Component("demo_dataprep")
c1 = gf.components.coupler_ring(cladding_layers=[(2, 0)], cladding_offsets=[0.5])
d = 0.8
c2 = gf.geometry.offset(c1, distance=+d, layer=(2, 0))
c3 = gf.geometry.offset(c2, distance=-d, layer=(2, 0))
c << c1
c << c3
c.plot()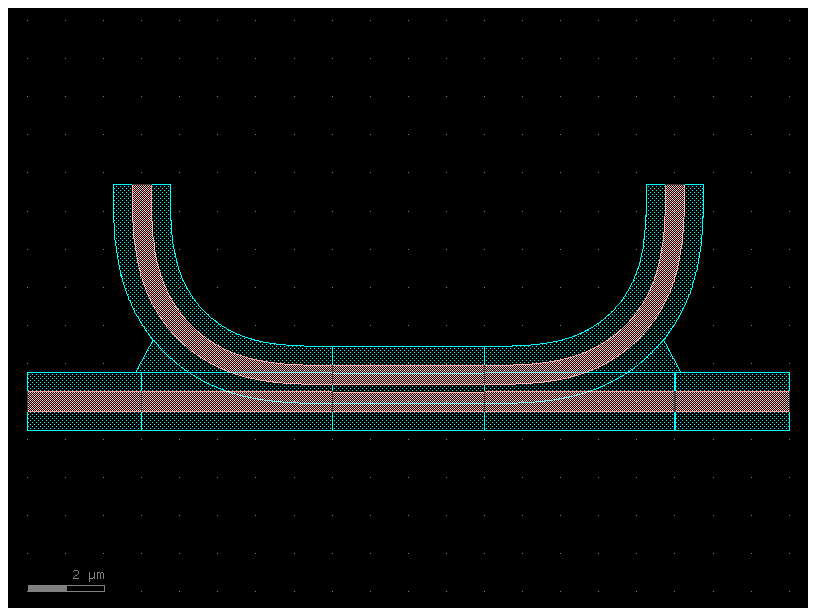
You can also run it as a decorator.
from functools import partial
from gdsfactory.geometry.maskprep import get_polygons_over_under, over_under

over_under_slab = partial(over_under, layers=((2, 0),), distances=(0.5,))

c = gf.components.coupler_ring(
    cladding_layers=((2, 0)),
    cladding_offsets=(0.2,),
    decorator=over_under_slab,
)
c.plot()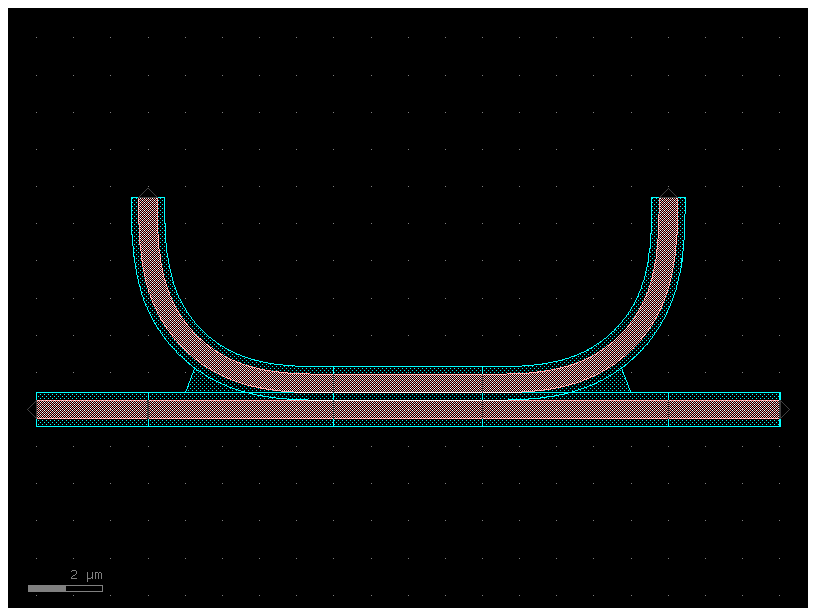
You can also add extra polygons on top
get_polygons_over_under_slab = partial(
    get_polygons_over_under, layers=((2, 0)), distances=(0.5,)
)

c = gf.Component("compnent_clean")
ref = c << gf.components.coupler_ring(cladding_layers=((2, 0)), cladding_offsets=(0.2,))
polygons = get_polygons_over_under_slab(ref)
c.add(polygons)
c.plot()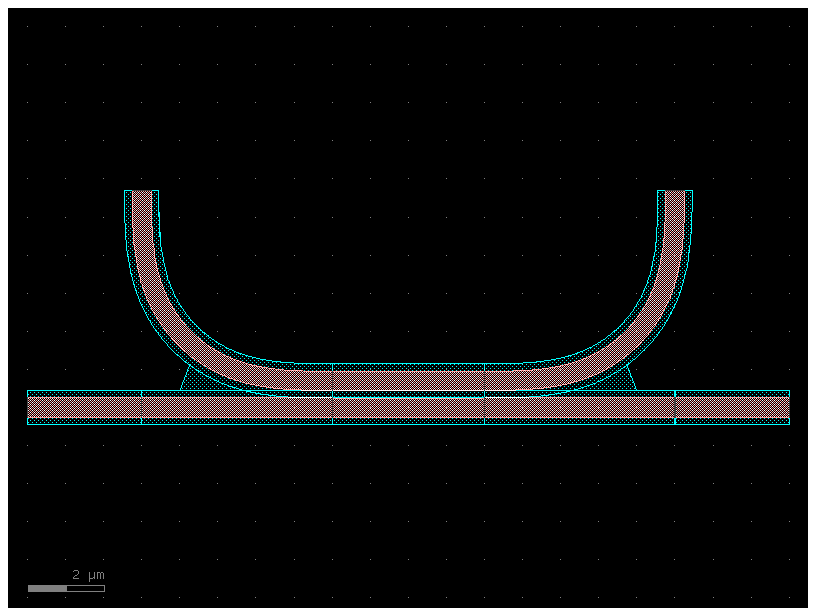
Outline
The outline() function takes the polygons of the input geometry then performs an offset and “not” boolean operation to create an outline. The function returns polygons on a single layer -- it does not respect layers.
import gdsfactory as gf

# Create a blank device and add two shapes
X = gf.Component("outline_demo")
X.add_ref(gf.components.cross(length=25, width=1, layer=(1, 0)))
X.add_ref(gf.components.ellipse(radii=[10, 5], layer=(2, 0)))

O = gf.geometry.outline(X, distance=1.5, precision=1e-6, layer=(3, 0))

# Plot the original geometry and the result
c = gf.Component("outline_compare")
c.add_ref(X)
c.add_ref(O).movex(30)
c.plot()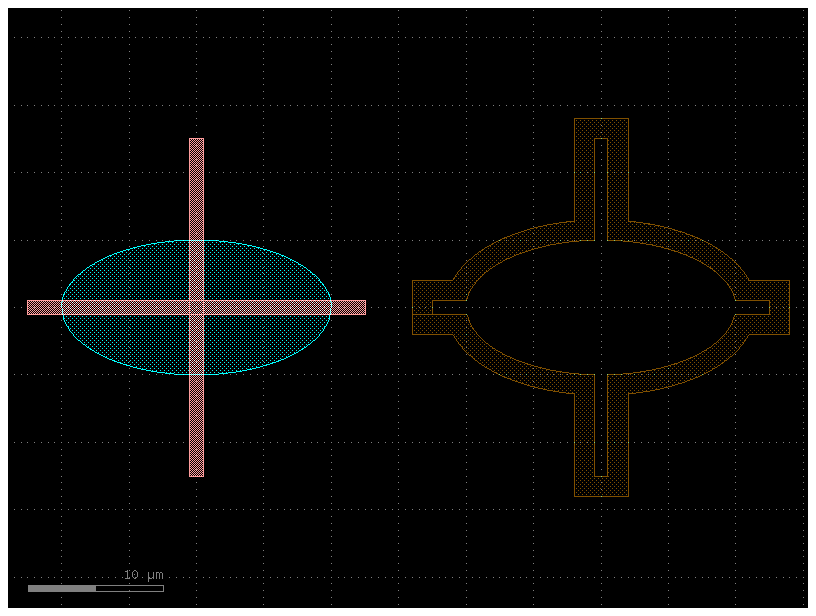
The open_ports argument opens holes in the outlined geometry at each Port location.
- If not False, holes will be cut in the outline such that the Ports are not covered.
- If True, the holes will have the same width as the Ports.
- If a float, the holes will be widened by that value.
- If a float equal to the outline
distance, the outline will be flush with the port (useful positive-tone processes).
c = gf.components.L(width=7, size=(10, 20), layer=(1, 0))
c.plot()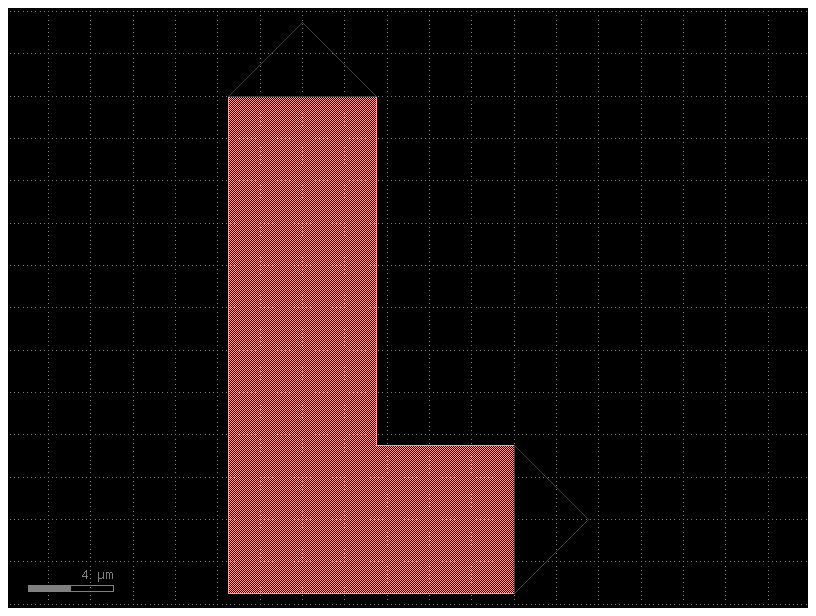
# Outline the geometry and open a hole at each port
c = gf.geometry.outline(offsets, distance=5, open_ports=False, layer=(2, 0))  # No holes
c.plot()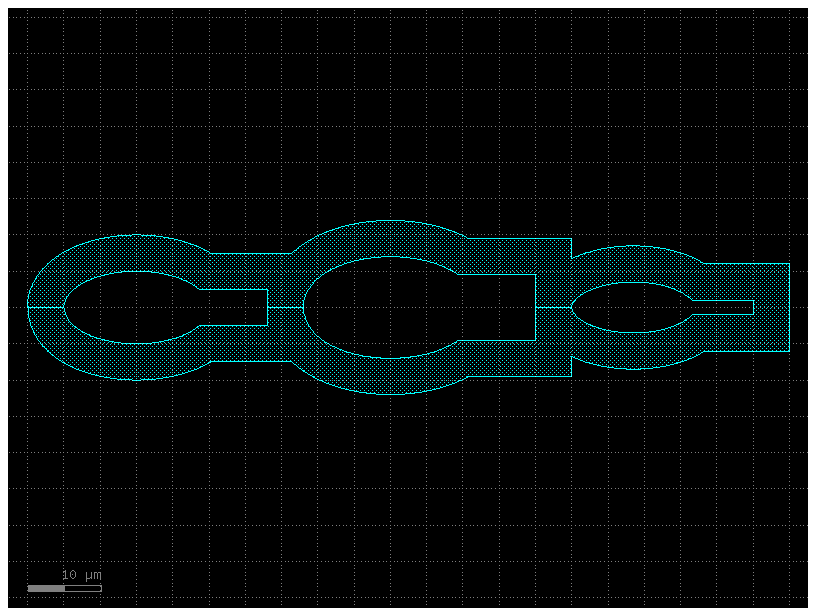
c = gf.geometry.outline(
    offsets, distance=5, open_ports=True, layer=(2, 0)
)  # Hole is the same width as the port
c.plot()
c = gf.geometry.outline(
offsets, distance=5, open_ports=10, layer=(2, 0)
) # Change the hole size by entering a float
c.plot()c = gf.geometry.outline(
offsets, distance=5, open_ports=5, layer=(2, 0)
) # Creates flush opening (open_ports > distance)
c.plot()Invert
Sometimes you need to define not what you keep (positive resist) but what you etch (negative resist). We have some useful functions to invert the tone.
The gf.boolean.invert() function creates an inverted version of the input geometry.
The function creates a rectangle around the geometry (with extra padding of distance border), then subtract all polygons from all layers from that rectangle, resulting in an inverted version of the geometry.
import gdsfactory as gf
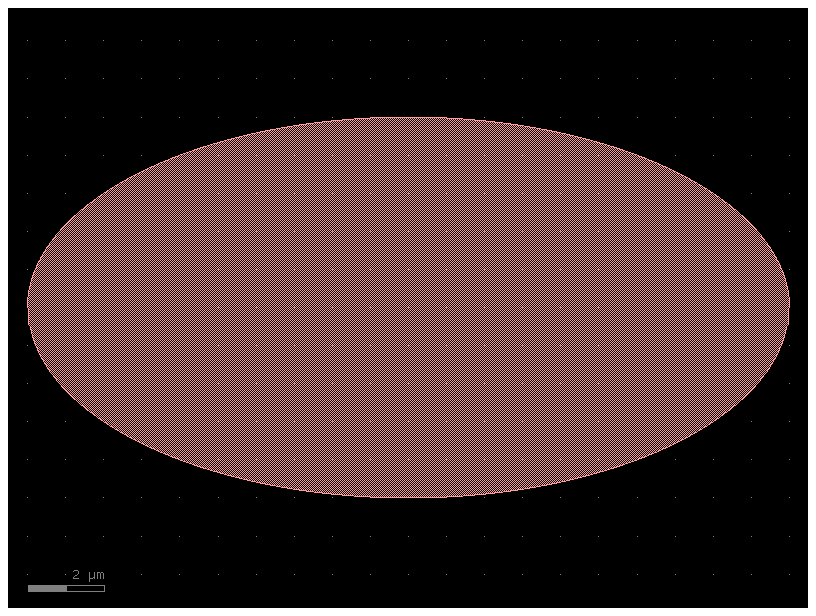
E = gf.components.ellipse(radii=(10, 5))
D = gf.geometry.invert(E, border=0.5, precision=1e-6, layer=(2, 0))
D.plot()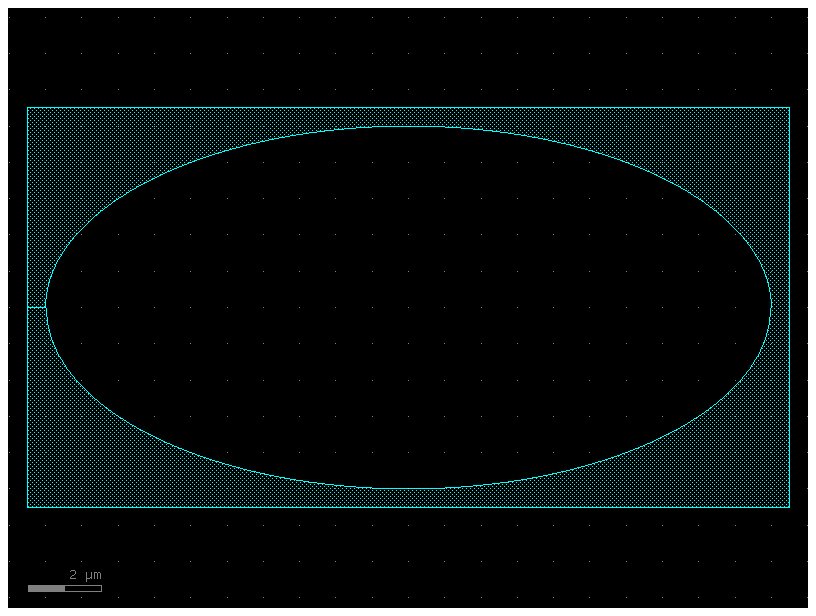
c = gf.components.add_trenches(component=gf.components.coupler)
c.plot()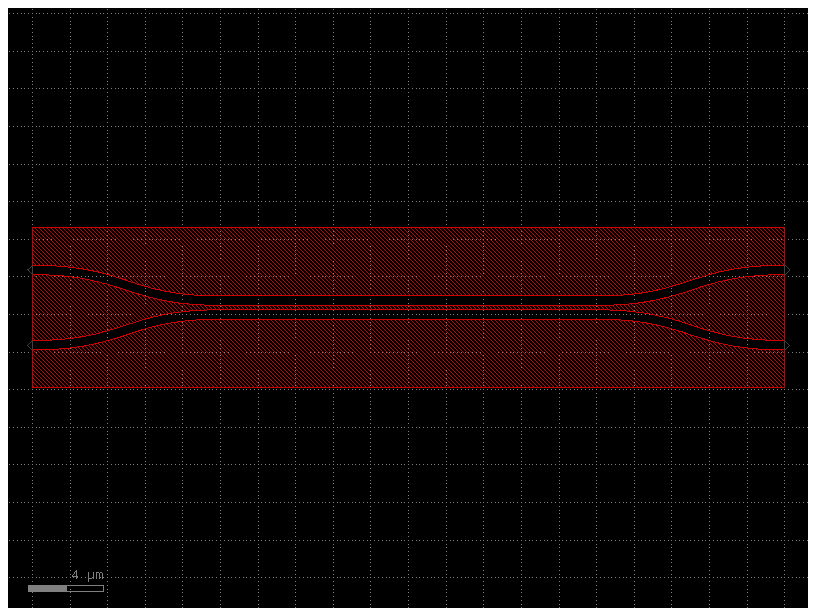
c = gf.components.add_trenches(component=gf.components.ring_single)
c.plot()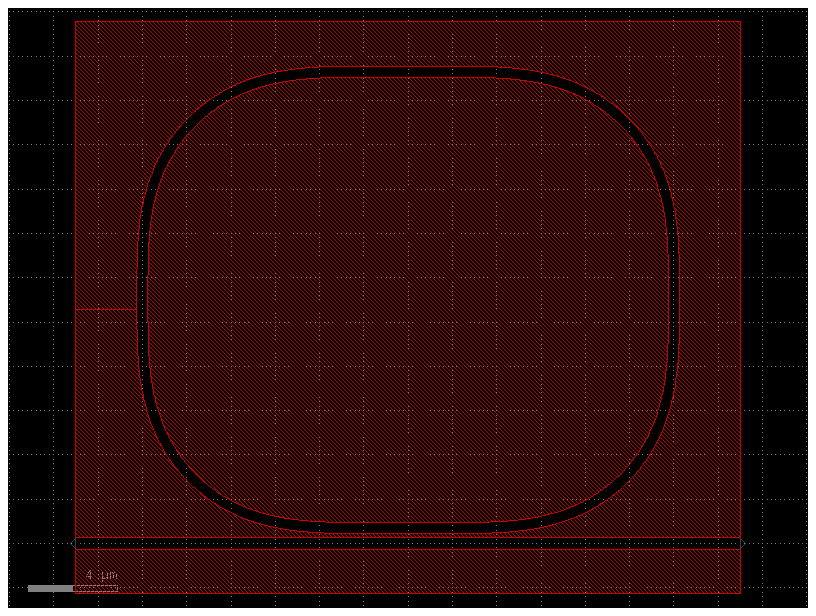
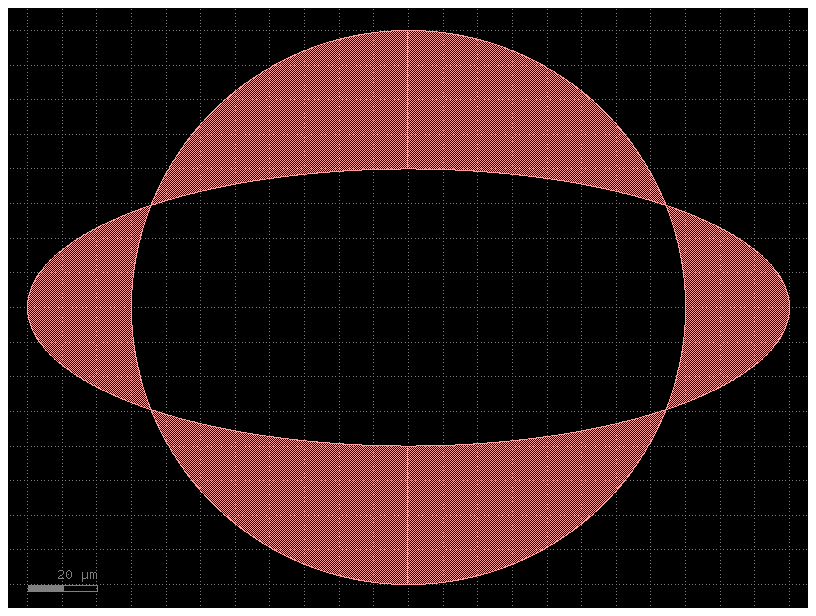
Union
The union() function is a “join” function, and is functionally identical to the “OR” operation of gf.boolean(). The one difference is it’s able to perform this function layer-wise, so each layer can be individually combined.
import gdsfactory as gf

D = gf.Component("union")
e0 = D << gf.components.ellipse(layer=(1, 0))
e1 = D << gf.components.ellipse(layer=(2, 0))
e2 = D << gf.components.ellipse(layer=(3, 0))
e3 = D << gf.components.ellipse(layer=(4, 0))
e4 = D << gf.components.ellipse(layer=(5, 0))
e5 = D << gf.components.ellipse(layer=(6, 0))

e1.rotate(15 * 1)
e2.rotate(15 * 2)
e3.rotate(15 * 3)
e4.rotate(15 * 4)
e5.rotate(15 * 5)

D.plot()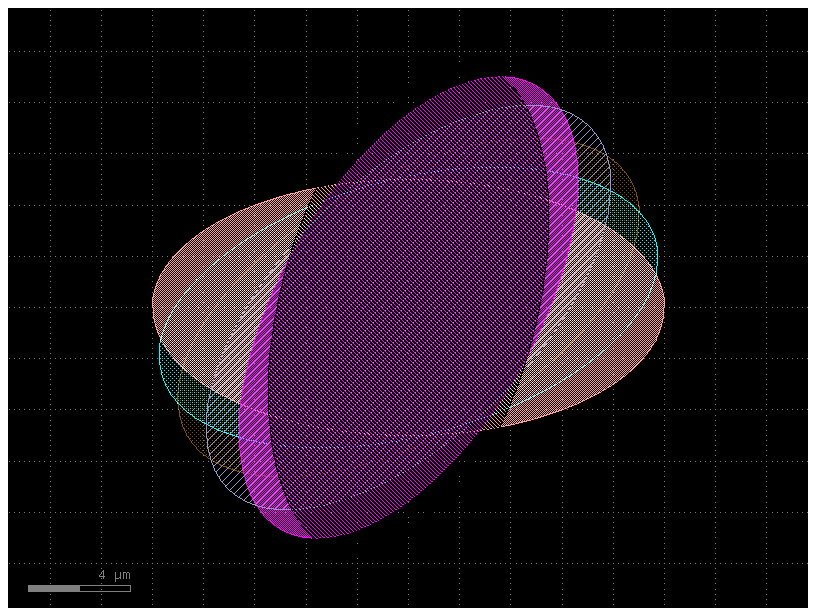
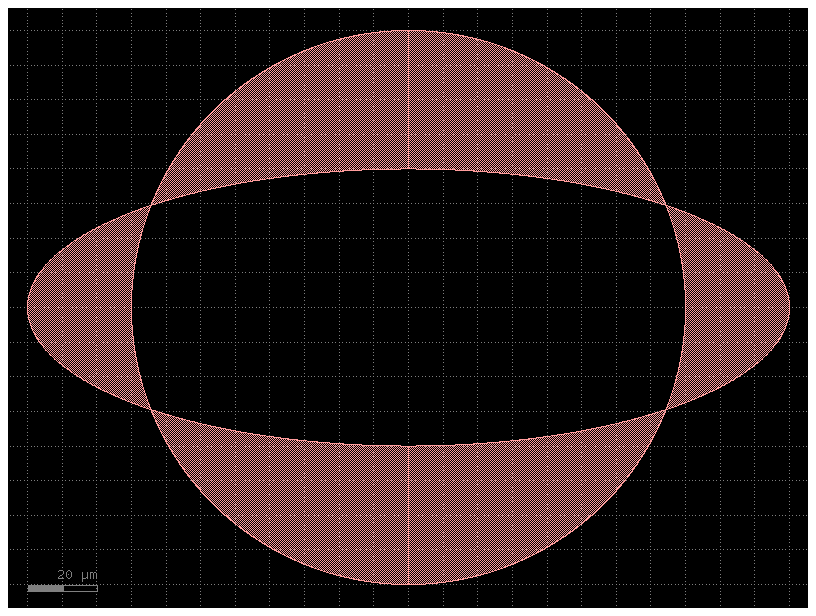
# We have two options to unioning - take all polygons, regardless of
# layer, and join them together (in this case on layer (2,0) like so:
D_joined = gf.geometry.union(D, by_layer=False, layer=(2, 0))
D_joined
2023-12-09 17:30:00.152 | WARNING | gdsfactory.klive:show:48 - Could not connect to klive server. Is klayout open and klive plugin installed?
union_c89e9033: uid 0dd2f253, ports [], references [], 1 polygons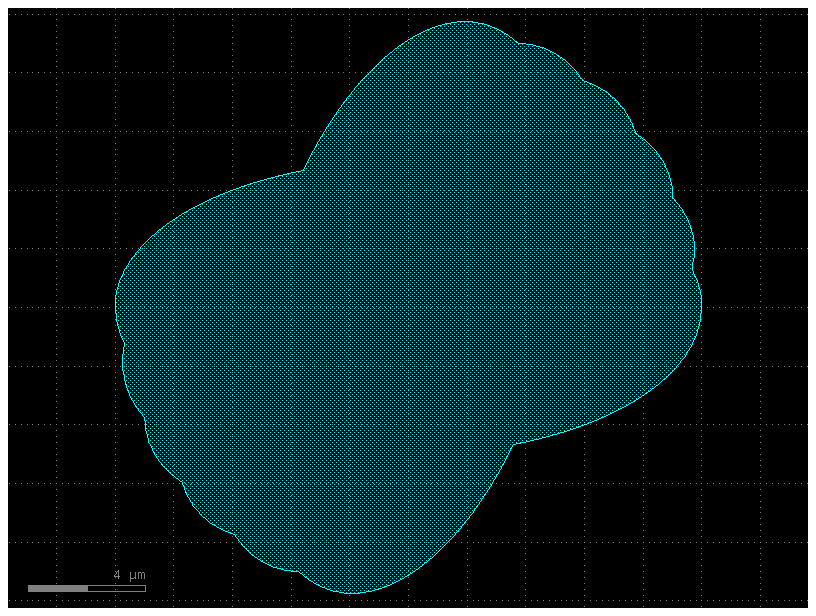
# Or we can perform the union operate by-layer
D_joined_by_layer = gf.geometry.union(D, by_layer=True)
D_joined_by_layer
2023-12-09 17:30:00.351 | WARNING | gdsfactory.klive:show:48 - Could not connect to klive server. Is klayout open and klive plugin installed?
union_40184f65: uid 61000cef, ports [], references [], 6 polygons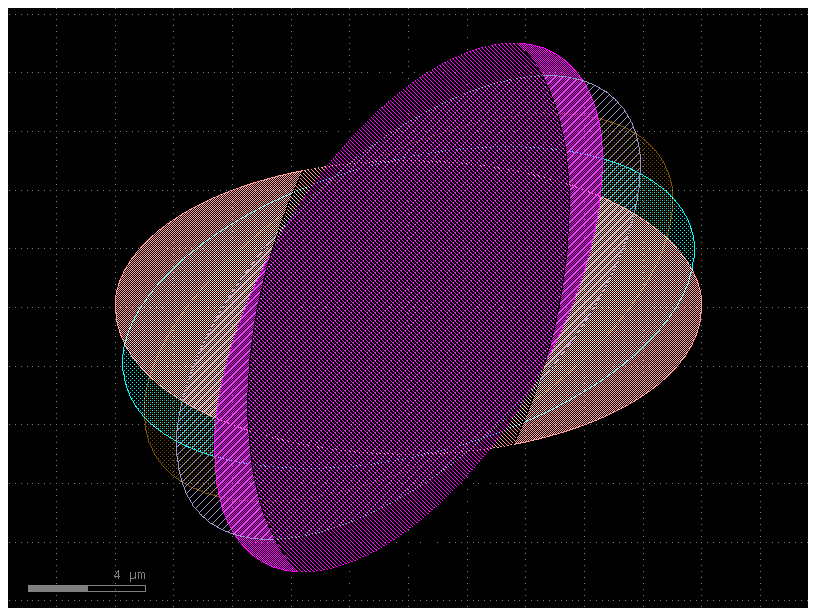
XOR / diff
The xor_diff() function can be used to compare two geometries and identify where they are different. Specifically, it performs a layer-wise XOR operation. If two geometries are identical, the result will be an empty Component. If they are not identical, any areas not shared by the two geometries will remain.
import gdsfactory as gf

A = gf.Component("A")
A.add_ref(gf.components.ellipse(radii=[10, 5], layer=(1, 0)))
A.add_ref(gf.components.text("A")).move([3, 0])

B = gf.Component("B")
B.add_ref(gf.components.ellipse(radii=[11, 4], layer=(1, 0))).movex(4)
B.add_ref(gf.components.text("B")).move([3.2, 0])
X = gf.geometry.xor_diff(A=A, B=B, precision=1e-6)

# Plot the original geometry and the result
# Upper left: A / Upper right: B
# Lower left: A and B / Lower right: A xor B "diff" comparison
D = gf.Component("xor_diff")
D.add_ref(A).move([-15, 25])
D.add_ref(B).move([15, 25])
D.add_ref(A).movex(-15)
D.add_ref(B).movex(-15)
D.add_ref(X).movex(15)
D.plot()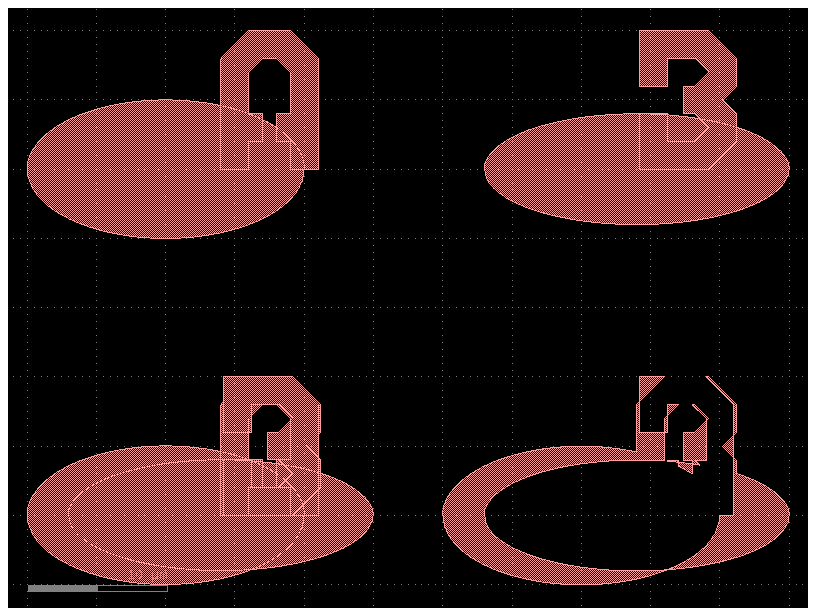
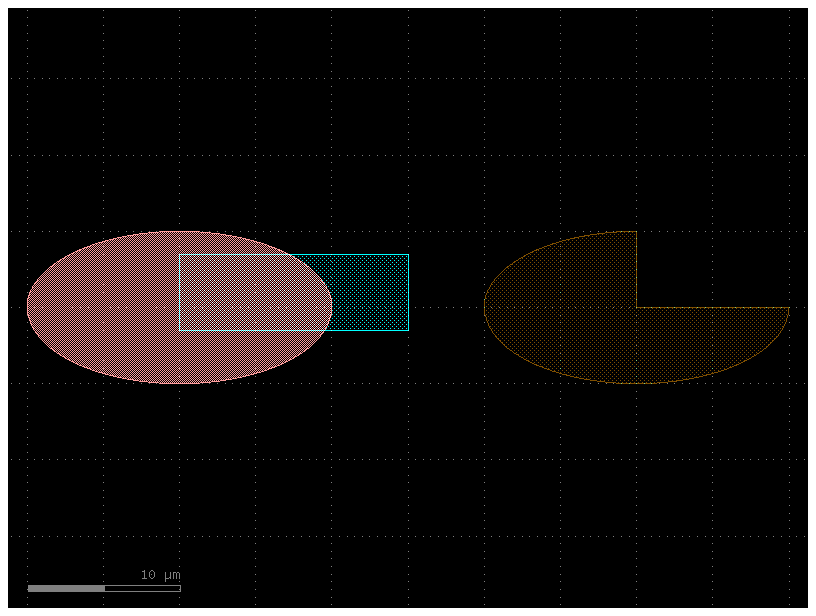
Trim
trim returns the portion of that component within that domain preserving all layers and (possibly) ports.
It’s like the opposite of “add_padding”, and also allows non-rectangular shapes for the padding removal.
Useful when resizing an existing component for simulations
c = gf.components.straight_pin(length=10, taper=None)
c.plot()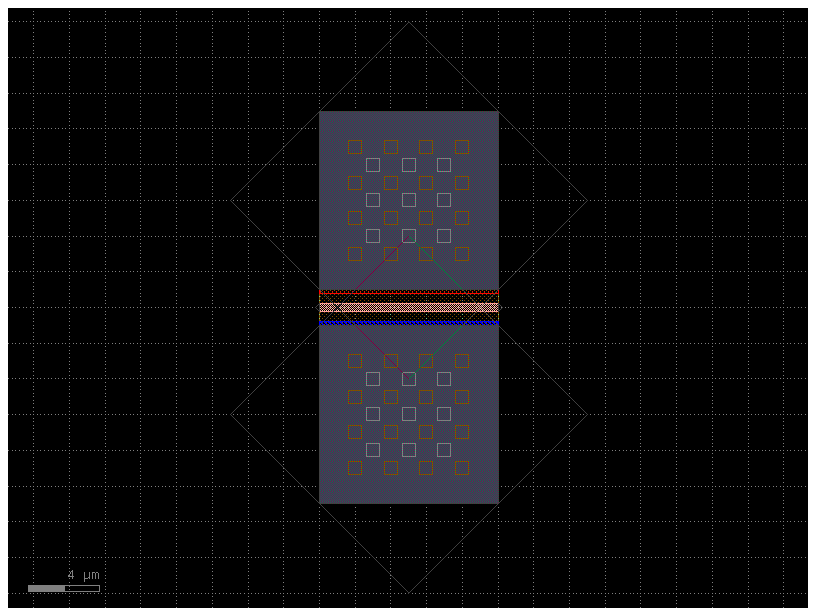
trimmed_c = gf.geometry.trim(component=c, domain=[[0, -5], [0, 5], [5, 5], [5, -5]])
trimmed_c.plot()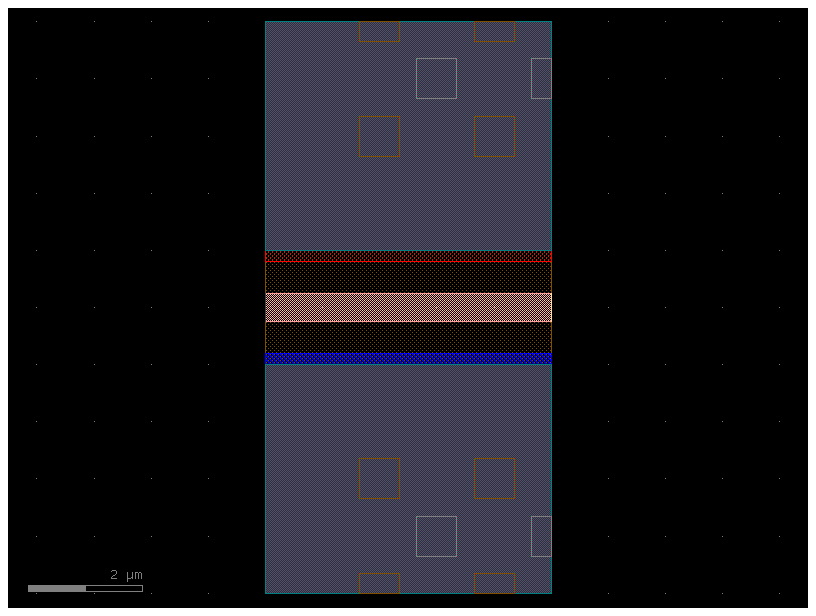
Importing GDS files
gf.import_gds() allows you to easily import external GDSII files. It imports a single cell from the external GDS file and converts it into a gdsfactory component.
D = gf.components.ellipse()
D.write_gds("myoutput.gds")
D2 = gf.import_gds(gdspath="myoutput.gds", cellname=None, flatten=False)
D2.plot()
2023-12-09 17:30:01.167 | INFO | gdsfactory.component:_write_library:1937 - Wrote to 'myoutput.gds'
Copying and extracting geometry
E = gf.Component()
E.add_ref(gf.components.ellipse(layer=(1, 0)))
D = E.extract(layers=[(1, 0)])
D.plot()
/home/runner/work/gdsfactory/gdsfactory/gdsfactory/component.py:1584: UserWarning: Unnamed cells, 1 in 'Unnamed_0aa2f65a$1'
gdspath = component.write_gds(logging=False)
import gdsfactory as gf

X = gf.components.ellipse(layer=(2, 0))
c = X.copy()
c.plot()
/home/runner/work/gdsfactory/gdsfactory/gdsfactory/component.py:1584: UserWarning: Unnamed cells, 1 in 'Unnamed_5a564e51$1'
gdspath = component.write_gds(logging=False)
c_copied_layers = gf.components.copy_layers(
    gf.components.straight, layers=((1, 0), (2, 0))
)
c_copied_layers.plot()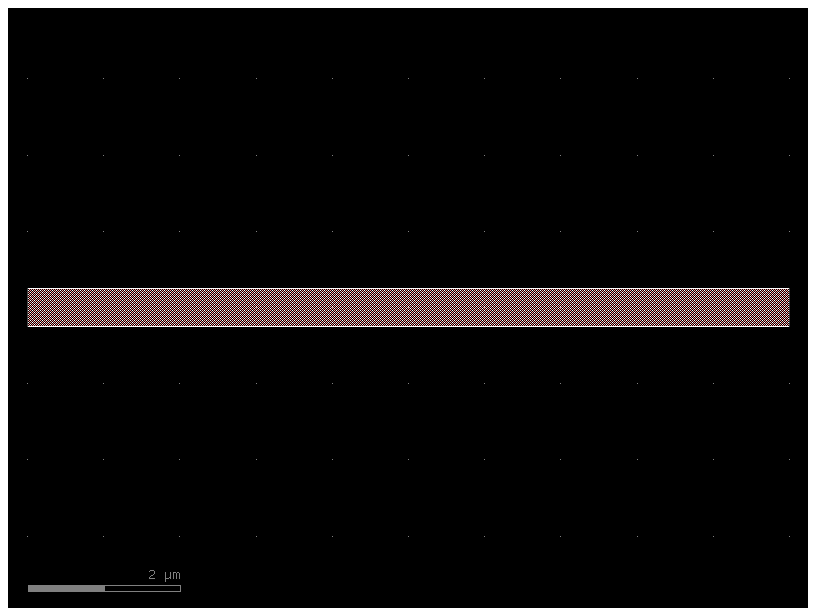
Import Images into GDS
You can import your logo into GDS using the conversion from numpy arrays.
from gdsfactory.config import PATH
from gdsfactory.read.from_np import from_image
import gdsfactory as gf

c = from_image(
    PATH.module / "samples" / "images" / "logo.png", nm_per_pixel=500, invert=False
)
c.plot()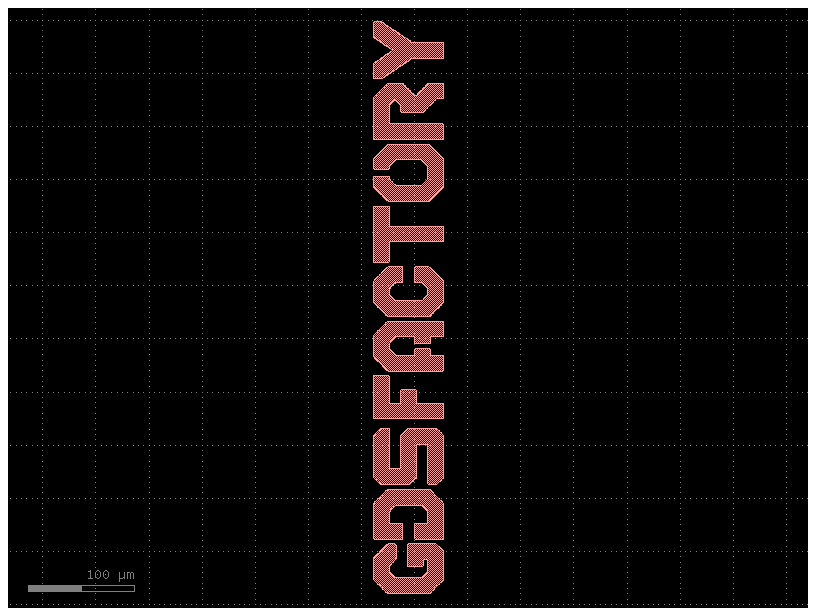
c = from_image(
    PATH.module / "samples" / "images" / "logo.png", nm_per_pixel=500, invert=True
)
c.plot()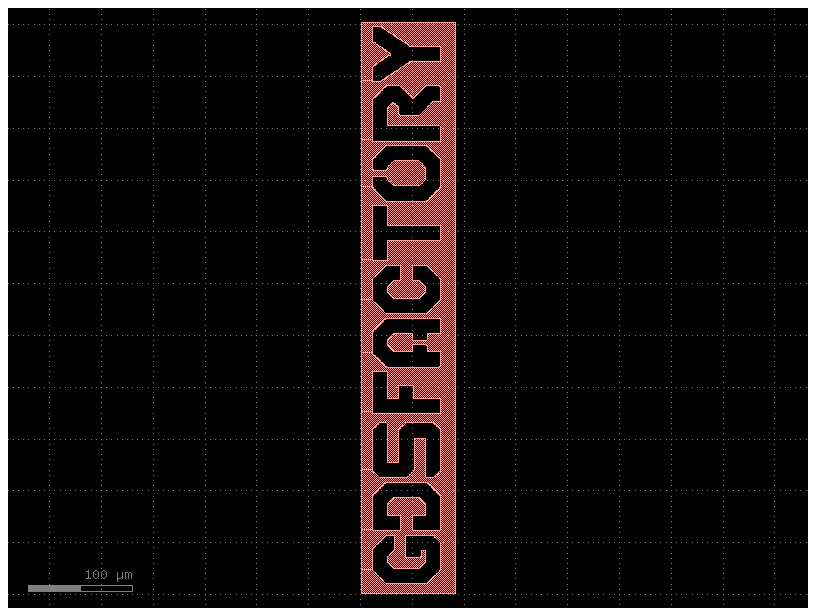
Dummy Fill / Tiling
To keep constant density in some layers you can add dummy fill rectangles.
coupler_lengths = [10, 20, 30, 40, 50, 60, 70, 80]
coupler_gaps = [0.1, 0.2, 0.3, 0.4, 0.5, 0.6, 0.7, 0.8]
delta_lengths = [10, 100, 200, 300, 400, 500, 500]

mzi = gf.components.mzi_lattice(
    coupler_lengths=coupler_lengths,
    coupler_gaps=coupler_gaps,
    delta_lengths=delta_lengths,
)

# Add fill
c = gf.Component("component_with_fill")
layers = [(1, 0)]
fill_size = [0.5, 0.5]

c << gf.fill_rectangle(
    mzi,
    fill_size=fill_size,
    fill_layers=layers,
    margin=5,
    fill_densities=[0.8] * len(layers),
    avoid_layers=layers,
)

c << mzi
c.plot()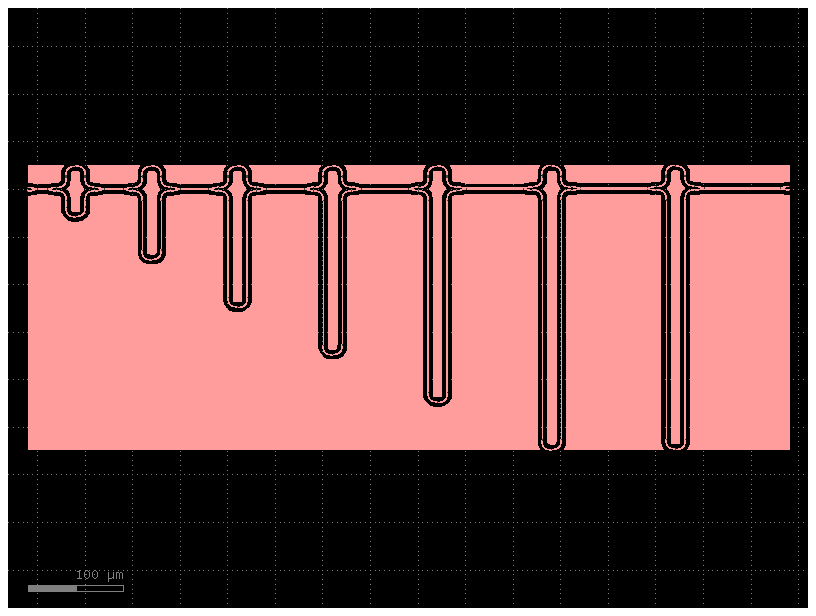
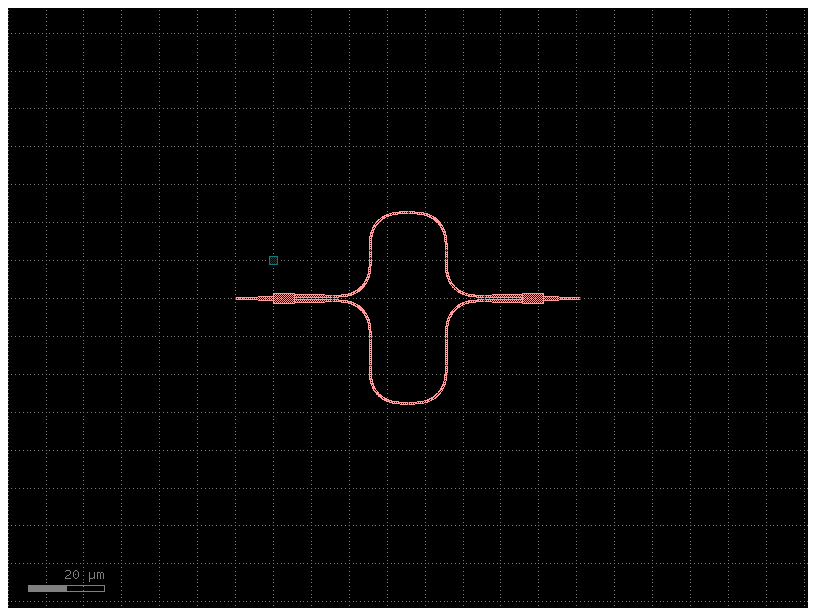
import gdsfactory as gf
from gdsfactory.geometry.fill_klayout import fill


@gf.cell
def cell_with_pad():
    c = gf.Component()
    c << gf.components.mzi(decorator=gf.add_padding)
    pad = c << gf.components.pad(size=(2, 2))
    pad.movey(10)
    return c


c = cell_with_pad()
gdspath = c.write_gds("mzi_fill.gds")
c.plot()
2023-12-09 17:30:03.823 | INFO | gdsfactory.component:_write_library:1937 - Wrote to 'mzi_fill.gds'
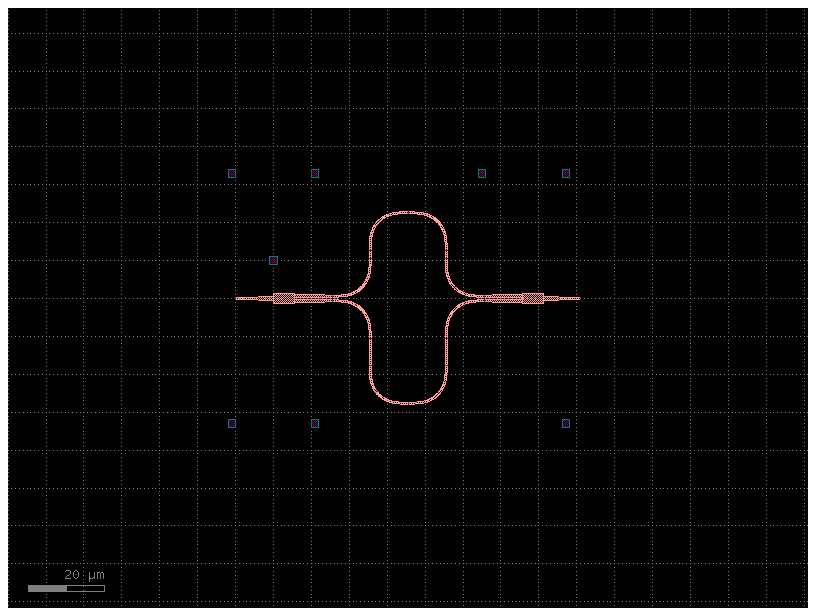
spacing = 20
fill(
    gdspath,
    fill_layers=("WG",),
    layer_to_fill=(67, 0),
    layers_to_avoid=(((1, 0), 0), ((49, 0), 0)),
    fill_cell_name="pad_size2__2",
    create_new_fill_cell=False,
    fill_spacing=(spacing, spacing),
    fill_size=(1, 1),
    include_original=True,
    layer_to_fill_margin=25,
)

c_fill = gf.import_gds(gdspath)
c_fill.plot()
2023-12-09 17:30:03.991 | INFO | kfactory.conf:__init__:106 - LogLevel: INFO
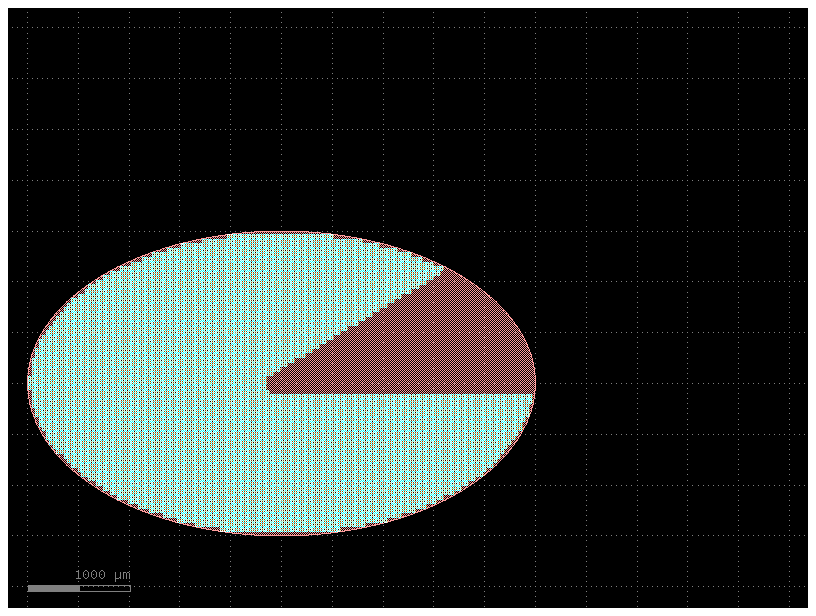
Tiling processor
For big layouts you can should use klayout tiling processor.
import kfactory as kf

import gdsfactory as gf
import gdsfactory.geometry.fill_tiled as fill

c = kf.KCell("ToFill")
c.shapes(kf.kcl.layer(1, 0)).insert(
    kf.kdb.DPolygon.ellipse(kf.kdb.DBox(5000, 3000), 512)
)
c.shapes(kf.kcl.layer(10, 0)).insert(
    kf.kdb.DPolygon(
        [kf.kdb.DPoint(0, 0), kf.kdb.DPoint(5000, 0), kf.kdb.DPoint(5000, 3000)]
    )
)

fc = kf.KCell("fill")
fc.shapes(fc.kcl.layer(2, 0)).insert(kf.kdb.DBox(20, 40))
fc.shapes(fc.kcl.layer(3, 0)).insert(kf.kdb.DBox(30, 15))

# fill.fill_tiled(c, fc, [(kf.kcl.layer(1,0), 0)], exclude_layers = [(kf.kcl.layer(10,0), 100), (kf.kcl.layer(2,0), 0), (kf.kcl.layer(3,0),0)], x_space=5, y_space=5)
fill.fill_tiled(
    c,
    fc,
    [(kf.kcl.layer(1, 0), 0)],
    exclude_layers=[
        (kf.kcl.layer(10, 0), 100),
        (kf.kcl.layer(2, 0), 0),
        (kf.kcl.layer(3, 0), 0),
    ],
    x_space=5,
    y_space=5,
)

gdspath = "mzi_fill.gds"
c.write(gdspath)
c = gf.import_gds(gdspath)
c.plot()
2023-12-09 17:30:04.230 | INFO | gdsfactory.geometry.fill_tiled:fill_tiled:182 - filling ToFill with fill
2023-12-09 17:30:04.315 | INFO | gdsfactory.geometry.fill_tiled:fill_tiled:185 - done with filling ToFill